What is J-score?
Welcome to J-score! This website provides an summarized overview of the Normal Distribution and its subtopics, such as the Z-Score, probability with the Normal Distribution, and the R-Score. The R-Score is especially interesting since it is widely used in CEGEPs in Quebec to assess academic performance, and it is difficult for students to calculate. Fortunately, we have built tools that can accurately predict the probability of getting into a university program based on a student's current R-Score, along with an R-Score calculator!
Section 1: Some definitions!
Variance
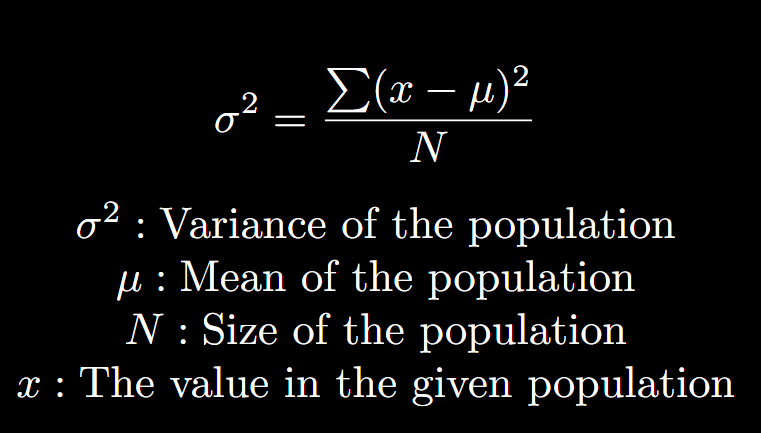
A variance shows how far values spread from the mean, which is the average of a sample set. The variance is found by averaging squared differences from that mean. It's squared to make large deviations count more, highlighting datasets with wide spread.
Standard deviation
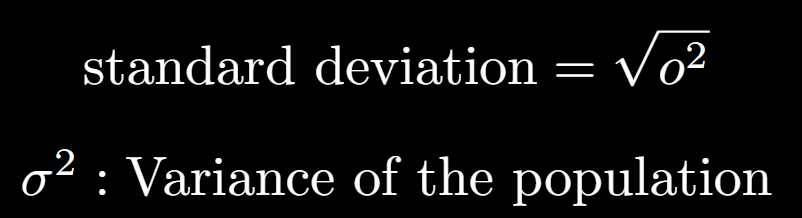
The standard deviation is the most common measure of data variability. A small standard deviation means that the data points are clustered near the mean, showing a low variability. A large standard deviation means that the data is widely spread out. The empirical rule states that 68% of all data falls within a standard deviation of the mean.
Standard Normal Distribution
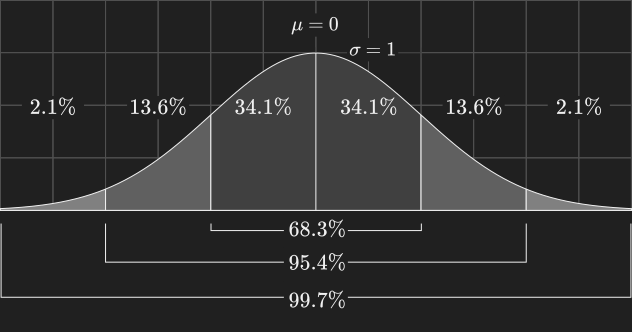
A standard normal distribution is a bell shape chart where most values cluster near the mean and fewer appear at the extremes. It's has a mean of 0 and a standard deviation of 1. A useful rule of thumb is the 68-95-99.7 rule: about 68% of values lie within one standard deviation of the mean, ~95% within two, and ~99.7% within three. This is assuming that the data are approximately near the mean. This lets use probabilities and compare results fairly across classes or tests.
Section 2: Z-Score (Standard Score)
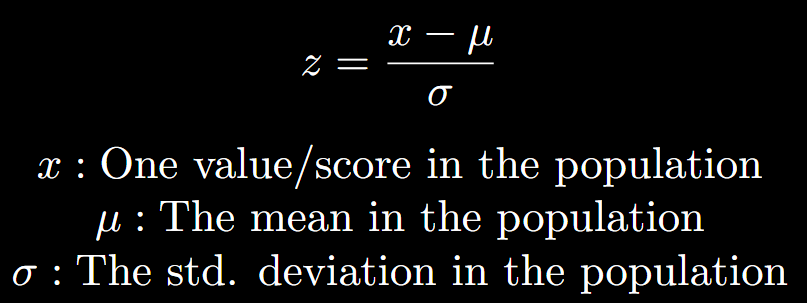
The Z-Score measures how many standard deviations a chosen data point is above or below the mean.
The Z-Score allows us to compare data. By converting each data point to Z-Scores, we can see how far away each data point is located from the standard deviation. A positive Z-Score indicates that the chosen data is above the average and a negative means it is below.
Section 3: Application in the Admissions Calculator
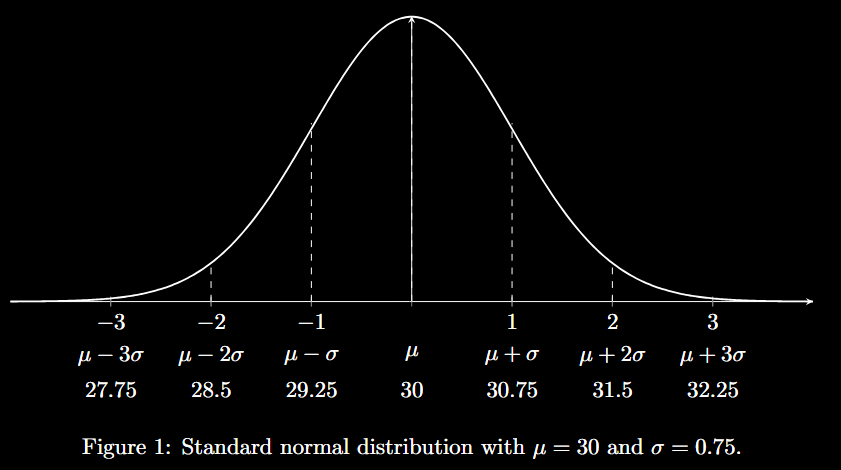
Our admissions calculator uses the Z-Score to calculate your chances of getting in to your dream college. We use the properties of a normal distribution, assuming that the the mean is 0.025 below the historical cut-off score and standard deviation is 0.75. Once you input your R-Score, our calculator standardizes it into a Z-Score. This Z-Score is then mapped to a percentile on the standard cure, providing you with a statistically approximated probability.
Example: In the graph, we used an example R-Score of 30.025 as the mean. If a student has an R-Score of 30.75, this is approximately one standard deviation above the mean. In a normal distribution, one standard deviation above the mean corresponds to 34.1% of the area. Because he is already above the mean, we add the 50% below the mean. This means the student is around the 84th percentile, so he has roughly an 84.1% chance of being above the required R-Score of 30.025.
Section 4: R-Score
The R-Score is equal to:

Here's what every variable means:
Z = the Z-Score for a course:- This is found using (the course grade - the course mean) / the course standard deviation
- This variable is defined as how good are the high school marks of the students in a CEGEP class.
- Students in the course are given high school Z-Scores, which are abased on their academic performance in ministerial high school courses.
- The IFGZ is the average of these high school Z-Scores.
- The range of this value is around [-1.5, 1.5]
- A higher ISGZ indicates that the course or group tends to have lower averages or tougher grading, which raises everyone's R-Scores slightly to maintain fairness and consistency across colleges.
- This variable measures the dispersion of the high school Z-Scores of a student compared to their classmates for a course. It's he standard deviation of high-school Z-Scores.
- In other words, it measures how diverse the highest marks of students in a CEGEP class.
- The range of this value is around [0, 1.5].
- A higher IDGZ means that your classmates, on average, performed very well before entering that course. In other words, you're in a stronger group.
- The first 5 (the "+ 5") reduces the possibility of a negative value in the score, while the second 5 (the "* 5") increases the scale of the score.
- The R-Score range is [0, 50] but most fall into [15, 35].
- Grades below 50 are not considered in calculating the average and the standard deviation for a grade distribution.
Why is it difficult to calculate an accurate R-Score?
The IFGZ and IDGZ are the only constants that are difficult to find without the prior data from High School. This data is protected by the Ministry of Education and the Bureau de coopération interuniversitaire (BCI). Therefore, these variables vary tremendously. As students, we cannot get these exact values and without those exact numbers, you can only estimate your R-Score.
How do we estimate your R-Score?
- The IDGZ is determined by the College class taken.
- If a student took a science concentration course for their program, the student is rewarded a higher IDGZ. It's because it's highly probable that the students taking that science class has higher overall grades. These grades usually don't have much difference from the average and the standard deviation is kept relatively low.
- If a student took a general education class, such as english, french, humanities, and gym, then they will have a lower IDGZ value. It's very probable that the students in that specific class come from any program, where student's overall grade is very varied. This means that the standard deviation is higher than a science class.
- The ISGZ is determined by three variables: a guess done by the user of the class's high school average, an average high school grade in the province, and the average standard deviation in the province. It's using the Z-Score formula, which helps determine whether the class performed stronger or weaker than the average Quebec student group, which is then reflected in the ISGZ adjustment.